NDVI: Measuring Plant Health and Vigor
The Normalized Difference Vegetation Index (NDVI) is the global standard for assessing photosynthetic activity, effectively serving as a 'plant health' check.
The Process: Analysis by Light
NDVI is achieved by comparing the difference in reflected near-infrared (NIR) and visible red light. Healthy plants strongly absorb visible light for photosynthesis and strongly reflect near-infrared light. The algorithm processes raw multispectral bands to visualize the ratio: plants reflecting minimal NIR appear stressed, while those with strong NIR reflection generate bright green colors on the map.
Farmer Benefits
NDVI maps visualize crop variability with precision, identifying nitrogen deficiencies, pest stress, and irrigation inefficiencies weeks before they are visible to the human eye. This allows for precision variable-rate application (VRA) of fertilizers and targeted scouting, saving input costs and protecting yield.
Moisture Content: Water Distribution
This index provides insight into the liquid water content within leaves and the top soil layers, mapping the spatial distribution of moisture across the entire field definition.
The Process: Swir Band Penetration
This map is achieved by analyzing reflected short-wave infrared (SWIR) and near-infrared (NIR) wavelengths. Leaf water strongly absorbs specific SWIR bands. If a leaf is dry, it reflects more SWIR, allowing the satellite to visualize areas with low water content. The ratio visualization highlights moisture variability in different soil types and across the plant canopy.
Farmer Benefits
Accurate moisture maps optimize irrigation scheduling, preventing over-watering and identifying localized water shortages. It helps predict drought impact and guides decisions on drainage investment, ensuring resources are distributed efficiently.
Soil Type and Classification
Our platform uses multi-temporal analysis and spectral signatures to map soil variability, identifying different texture types and organic matter differences without the need for intensive physical soil sampling.
The Process: Multi-temporal Signature
The system analyzes bare-earth images taken between planting seasons. Variations in color and texture (derived from visible and infrared reflectance) indicate different soil classifications. By stacking years of data, the algorithm can distinguish permanent soil features from seasonal vegetation differences, mapping variations in sand, silt, and clay content.
Farmer Benefits
Mapping soil variability is fundamental to precision agriculture. This map allows farmers to establish accurate variable-rate seeding and fertilization prescriptions, adjusting input density to match the natural yield potential of different soil zones.
Thermal (Water Stress) Index
The Thermal Stress Index measures crop temperature, identifying metabolic variations linked directly to transpiration and water availability.
The Process: Emitted Heat Detection
This map is achieved using specialized thermal infrared bands that measure long-wave radiation emitted by the land surface. Stressed plants close their stomata to conserve water, reducing transpiration, which causes their surface temperature to rise. The algorithm analyzes this emitted heat to generate a map visualizing relative water stress with high sensitivity.
Farmer Benefits
Thermal maps are critical for immediate irrigation management. They detect water stress earlier than most reflection-based indices, allowing for rapid irrigation responses before yield loss occurs. It is invaluable for managing high-value, drought-sensitive crops.
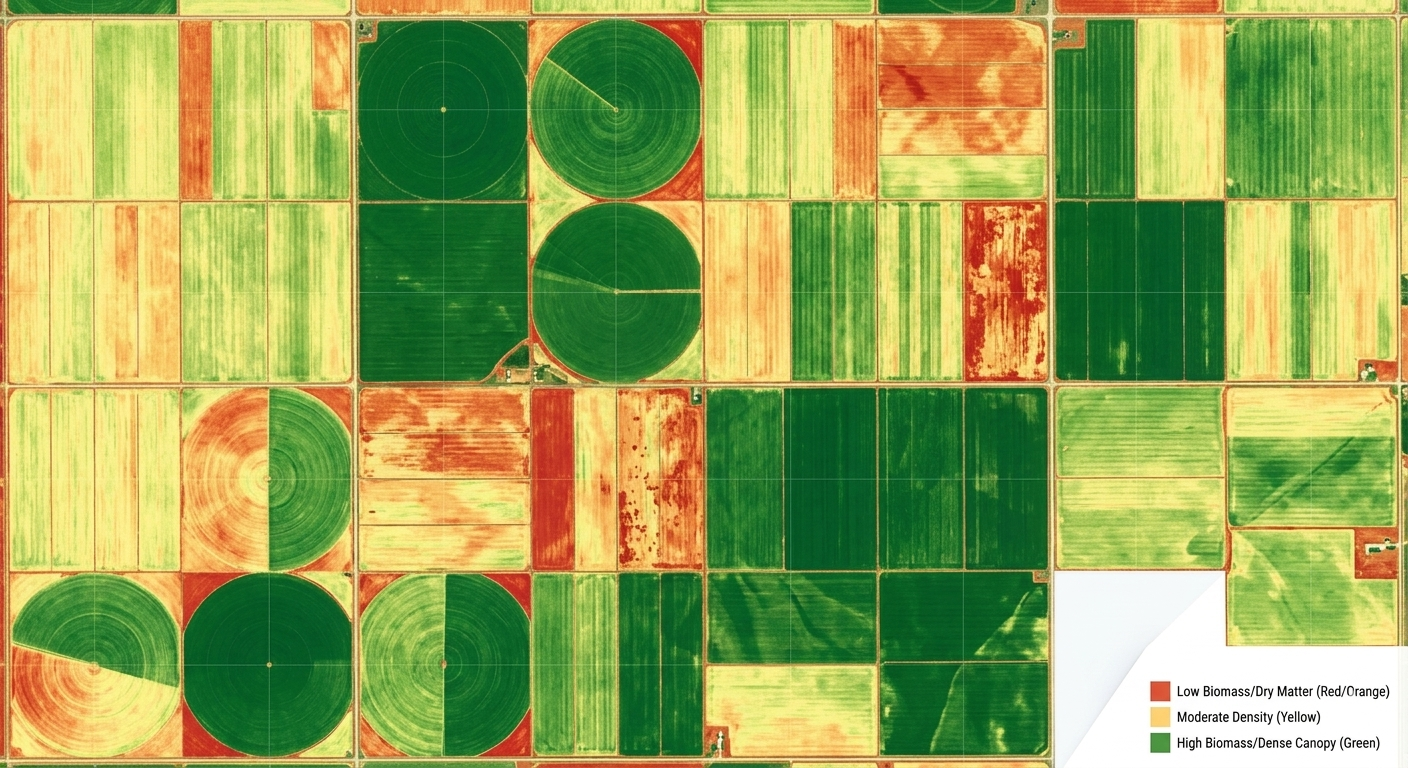
NDMI: Biomass and Density Index
The Normalized Difference Moisture Index (NDMI), often optimized as a general biomass indicator, visualizes the density and quantity of living vegetation in the field.
The Process: Canopy Reflectance
While often used for moisture, specific combinations of SWIR and NIR wavelengths are highly sensitive to the total density of the vegetation canopy. A dense, healthy canopy absorbs more SWIR and reflects more NIR. The system processes these bands to visualize variations in biomass, distinguishing thick vegetation from sparse growth or bare soil.
Farmer Benefits
Biomass maps track crop development throughout the season, helping to monitor growth stages. They are essential for accurate yield forecasting and identifying areas of weak development that may require additional management attention.